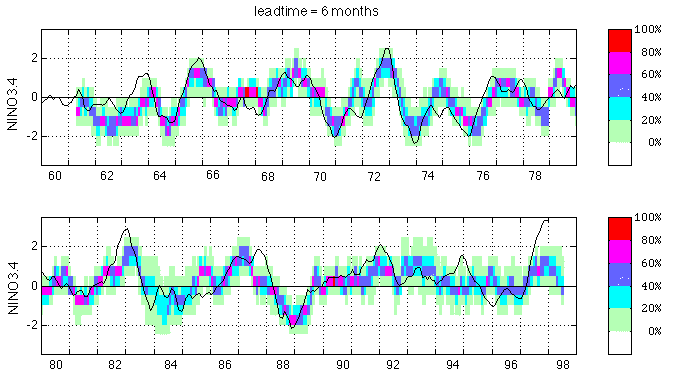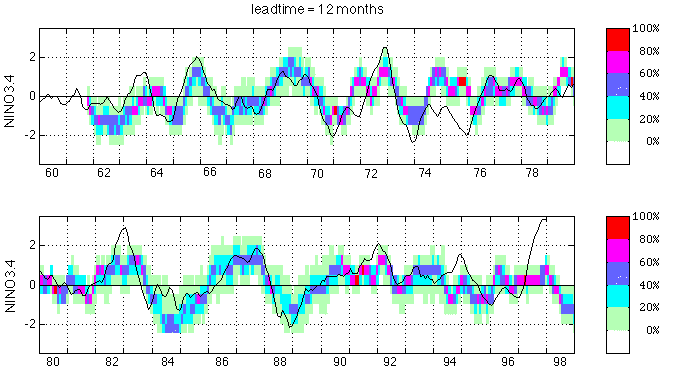
Our neural network model is an ensemble model of 100 members neural networks. Usually one only looks at the average of members forecasts as the forecast of the ensemble model. Here we take a more detailed look at the distribution of the member forecasts around the average, as a measure of the certainty of the forecast.
In the following figures, the temperature range from -2.5oC to 2.5oC is divided to 10 bins of 0.5oC each. Then the percentage of the ensemble member forecasts that fall into each bin is calculated. The percentage values are shown by the color codes. The black line is the observed NINO3.4. We can regard the percentage of a bin as the probability that the model forecast is likely to fall into the bin.

