We recently implemented a procedure called bootstrap aggregating, or bagging, to increase the skills and the stability of our neural network models.
Bagging (Breiman 1996) works as follows: First training pairs, consisting of the data at the initial time and the forecast target of certain months (leadtime) later, are formed. The available training pairs are separated into a training set and a test set. The test set is reserved for testing only and not used for training. The training set is used to generate an ensemble of neural network models; each member of the ensemble is trained by only a subset of the training set. The subset is drawn at random with replacement from the training set. The subset has the same number of training pairs as the training set; some pairs in the training set appear more than once in the subset, and about 37% of the training pairs in the training set are absent in the subset. The final model output is the average of the outputs from all members of the ensemble.
The advantage of bagging is to reduce the variance, or instability of the neural network. The error surface of neural network training is full of local minima; trainings with different initial weights and training data are usually trapped in different local minima. These local minima reflect partly the fitting to the regularities of the data and partly the fitting to the noise in the data. Bagging tends to cancel the noise part as it varies among the ensemble members, and tends to retain the fitting to the regularities of the data. The ensemble in our bagging neural network model has 30 members.
The neural networks were trained with the NINO3.4 index (from http://nic.fb4.noaa.gov/data/cddb/), and the COADS monthly sea level pressure (SLP) data of the tropical Pacific Ocean (Woodruff et al 1987, from http://www.cdc.noaa.gov/coads/ ). The gridded SLP data were first summed into 3-month averages and then reduced to a few EOF modes.
The neural networks in this forecast have 31 inputs and 5 hidden neurons. The NINO3.4 index, and the first 7 EOF time series of the SLP EOF of the initial month form the first 8 inputs. The first 7 EOF time series of 3 months, 6 months and 9 months before the initial month are also used as inputs. The last 2 inputs are the sin and cos of a 12-month period to simulate the annual cycle.
We have designed a cross-validation scheme which estimated the forecast skill of the NN models. For each lead time from 3 months to 15 months and for each given year from 1950 to 1997, data from a window of 5 years, starting from January of the given year, were withheld. Training pairs were composed from the remaining data. After the model was trained, 12 forecasts, initialized from 12 consecutive months starting from November of the year before the given year, were made. Then the 5-year window was moved forward by 12 months and the procedure was repeated. The choice of 5-year windows is for the balance of avoiding the influence of the training data on the test data and allowing an efficient use of the available data. The forecast target month is at least 24 months away from the training data that follow. The overlapping between the forecast input data and the training data is legitimate as it also happens in real time forecasting.
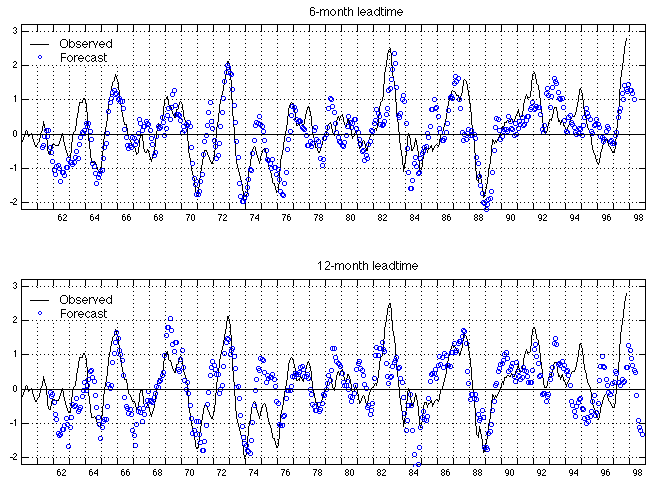
All the forecasts for a given lead time were collected to form a continued forecast NINO3.4 time series. The two panels of Fig.1 compare the forecast NINO3.4 at leadtimes 6 months and 12 months with the observed NINO3.4. The Correlation coefficients between the forecast and observed NINO3.4 were calculated as skills for each decade from 1950s to 1990s, and for the whole period as well. The results are listed in Table 1.
Table 1. The test correlation skills for different test periods
test period  3-month  6-month  9-month  12-month  15-month
1960-1969      0.84     0.67     0.64     0.61      0.56
1970-1979      0.91     0.76     0.61     0.50      0.38
1980-1989      0.89     0.78     0.75     0.73      0.66
1990-1997      0.78     0.38     0.25     0.33      0.32
1960-1997      0.87     0.71     0.62     0.56      0.46
Breiman, L., 1996: Bagging predictions. Machine Learning, 24, 123-140.
Tangang, F.T., W.W. Hsieh and B. Tang, 1997: Forecasting the equatorial Pacific sea surface temperatures by neural network models. Climate Dynamics, 13, 135-147.
Woodruff, S.D., R.J. Slutz, R.L. Jenne, and P.M. Steurer, 1987: A comprehensive ocean-atmosphere data set. Bull. Am. Meteorol. Soc., 6, 1239-1250.